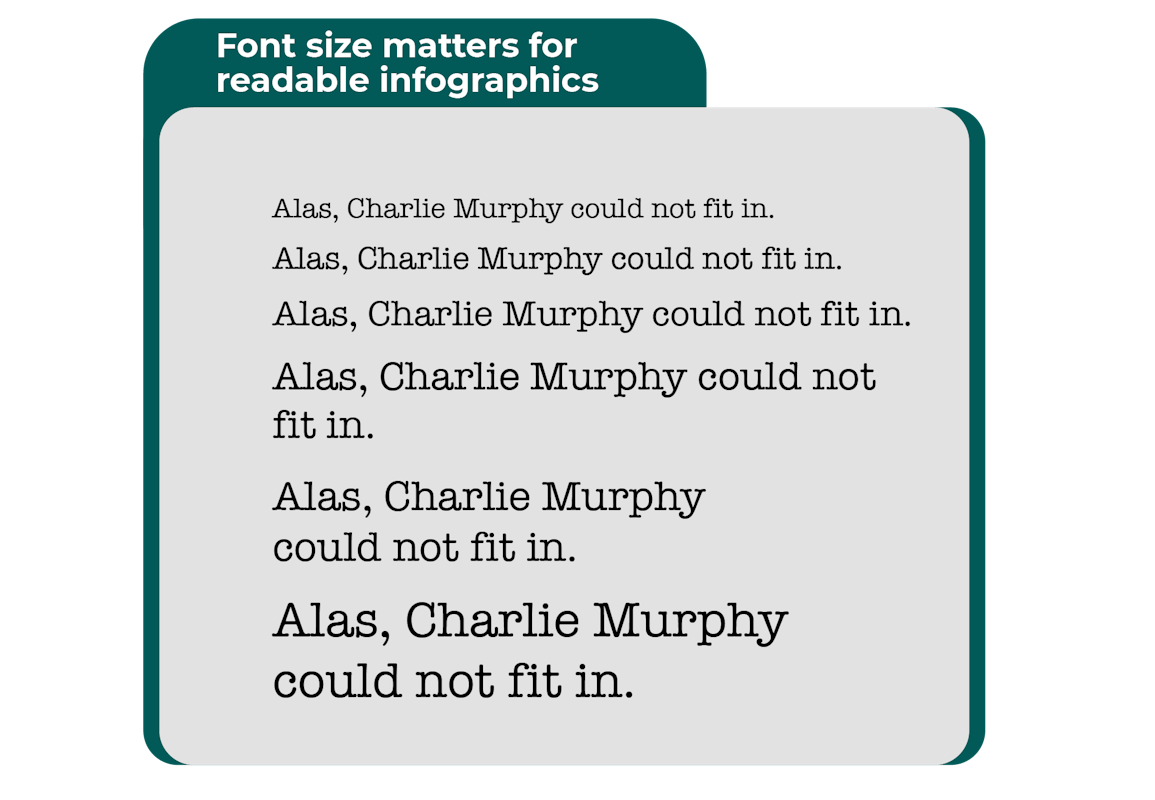
These days, attention spans are shorter than ever, thanks to the rise of social media platforms focused on delivering important information in a three-minute or less video. In fact, Netflix is losing subscribers daily due to its audience no longer being able to focus on watching an entire episode of a TV show or a movie. To combat these short attention spans, brands are utilizing infographics more than ever due to their ability to deliver informative content in an efficient way. The catch for content marketers, though, is to deliver mobile-friendly content in an informative yet efficient way. One of these attention-keeping deliverables is mobile-friendly infographics. Creating an infographic is a large undertaking and for many brands, it is not within their bandwidth to recreate a version of the infographic for desktop users and another version for mobile users. Using these seven tips, you will be able to create optimized, responsive, and mobile-friendly infographics that look great for desktop users, too. Pinch. Zoom in. Zoom out. Rotate. These are just a few tricks you have to do when you’re attempting to read something on your phone that includes a poor choice of font type. Choosing fonts, such as Garamond, Lato, and Corbel, is crucial to making sure your audience can read without having to perform extra tricks. Having the right font type is one step toward creating a mobile-friendly infographic. The next step is choosing the right font size. A general rule of thumb is for font sizes to be 16 pixels or a bit larger. Too large of font, though, can make the text difficult to read. Did you know the brain processes visuals 60 times faster than written content? Limiting written content to just the facts helps keep the infographic mobile-friendly while also allowing the content to be absorbed effectively by the readers. When it comes to written text in infographics, less is more. You know how important visuals are, but using the right visuals is key to a mobile-friendly infographic. The eyes can register nearly 36,000 visual messages in 60 minutes, averaging out to 600 per minute!1. Pay Attention to Font Type
2. Font Size Matters, Too
3. Limit the Word Count
4. Choose the Right Visuals
When choosing visuals to use, start with a theme based on your content. This will help guide you as you lay out the imagery. Next, choose a color scheme. Pairing the right colors together helps make certain elements and information more prominent than others.
Design for Tips or Number-Based Graphics

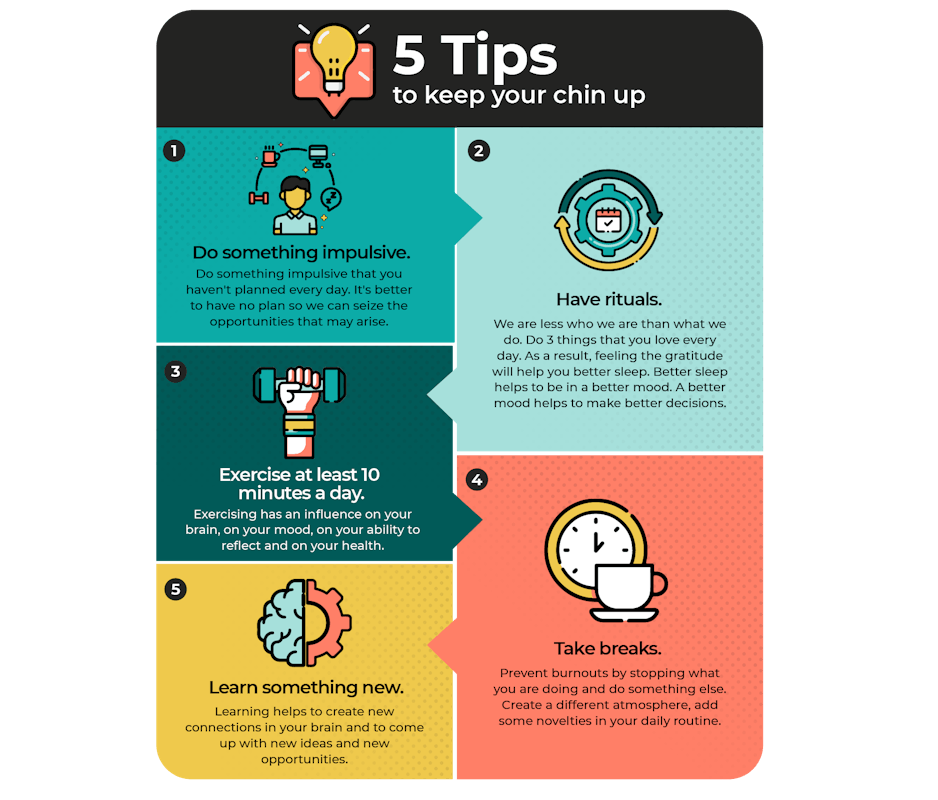
Design for How-To Infographics

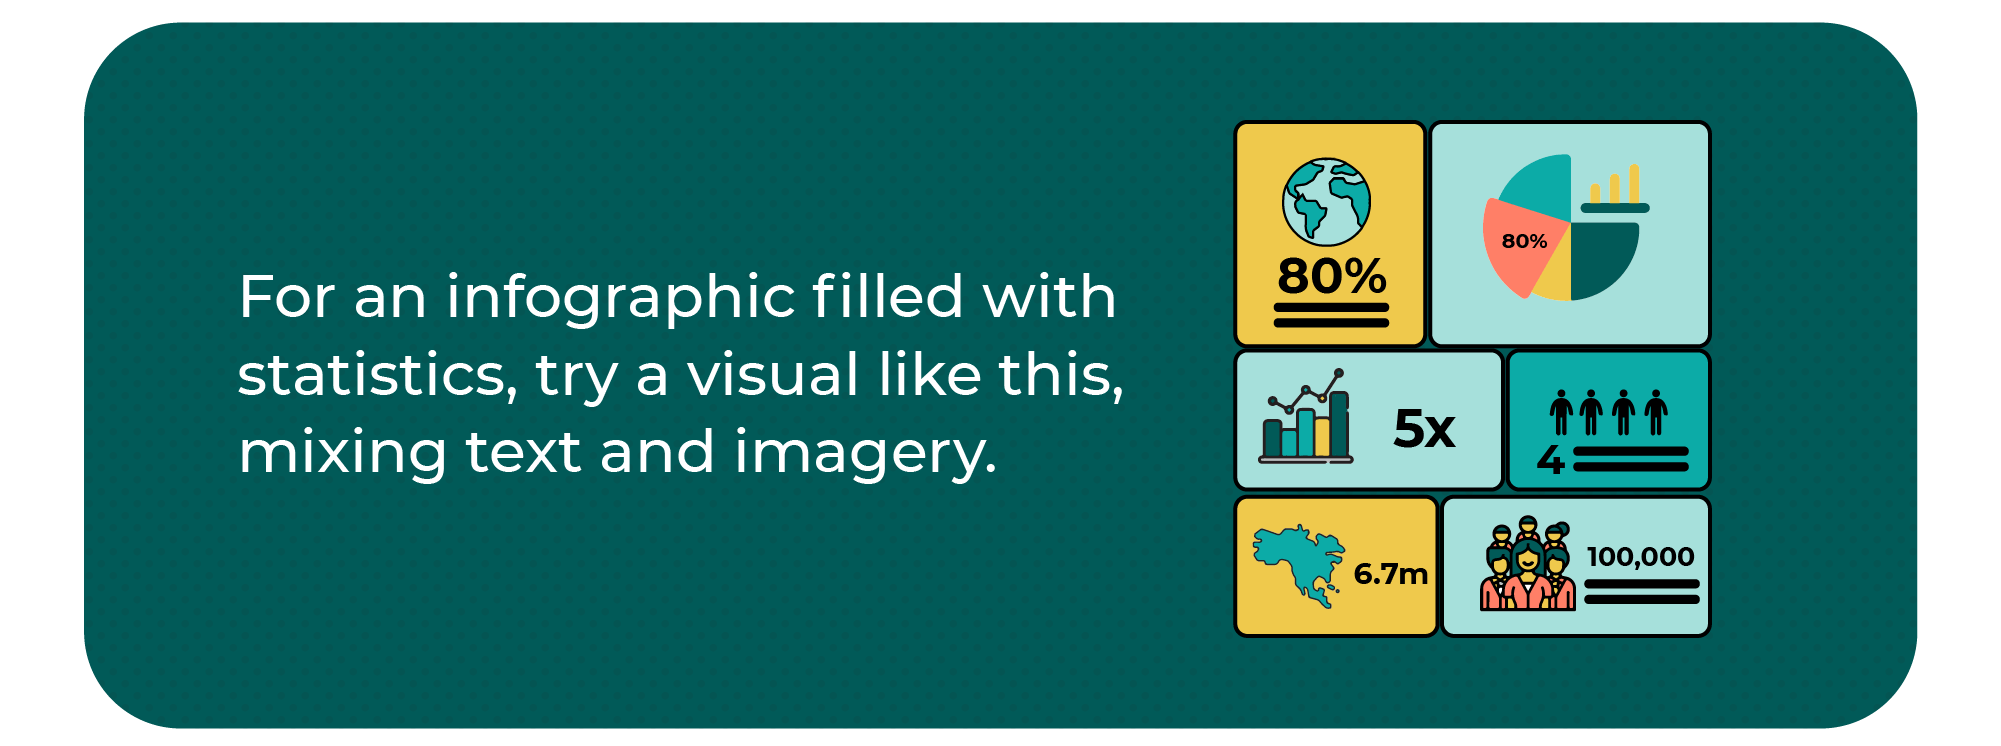
Design for Statistic Infographics
5. Optimize It
Infographics are often treated as a side piece to blog posts, but when optimized correctly, they can increase your website traffic. Infographics are great link building tools that drive organic traffic when optimized properly.
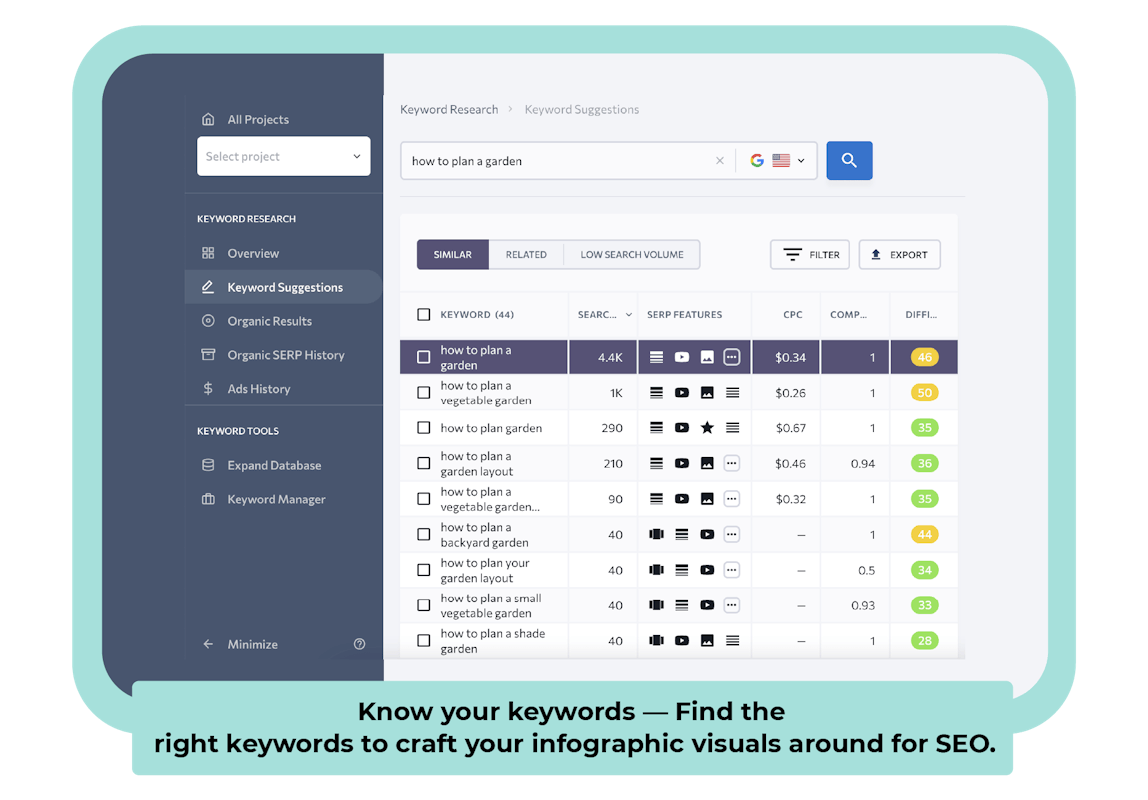
Optimize Keywords
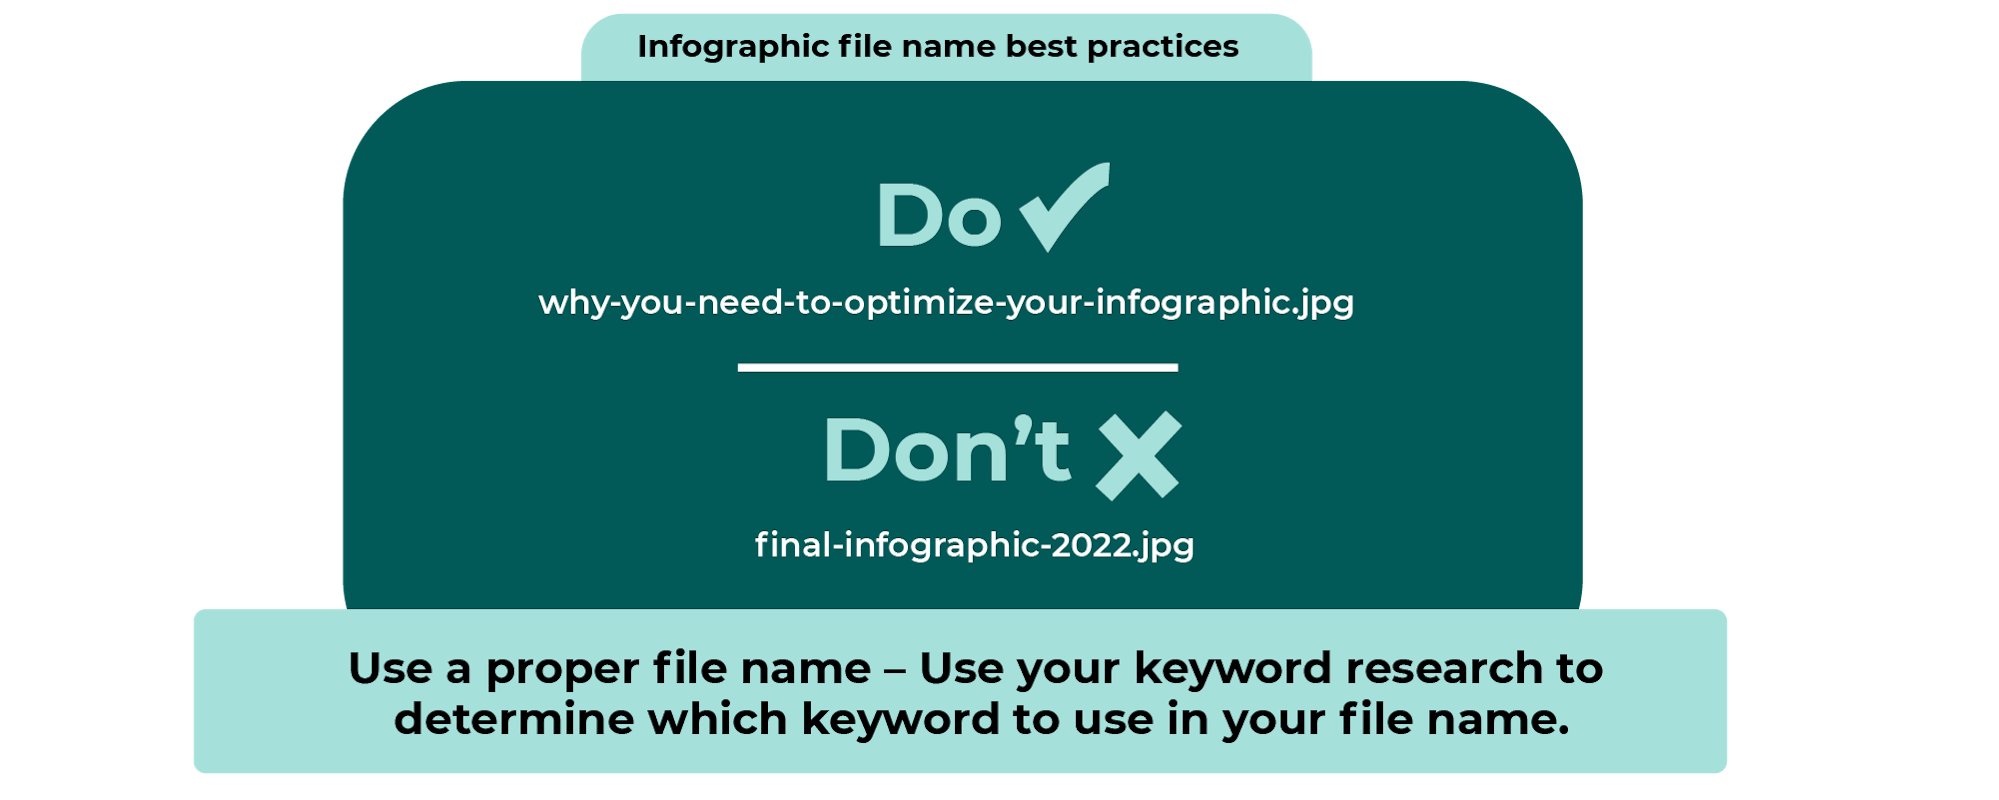
Optimize the File Name
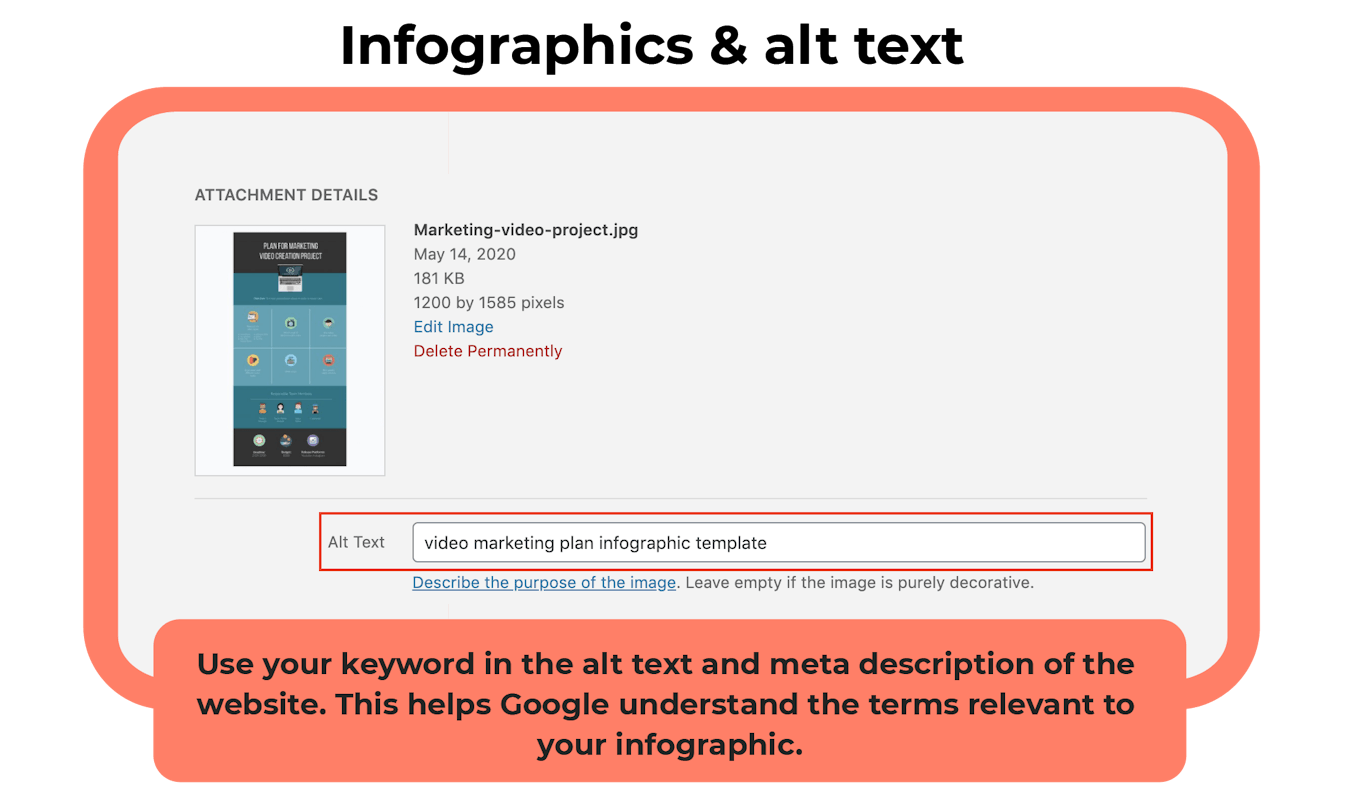
Optimize the Alt Text
6. Make It Responsive
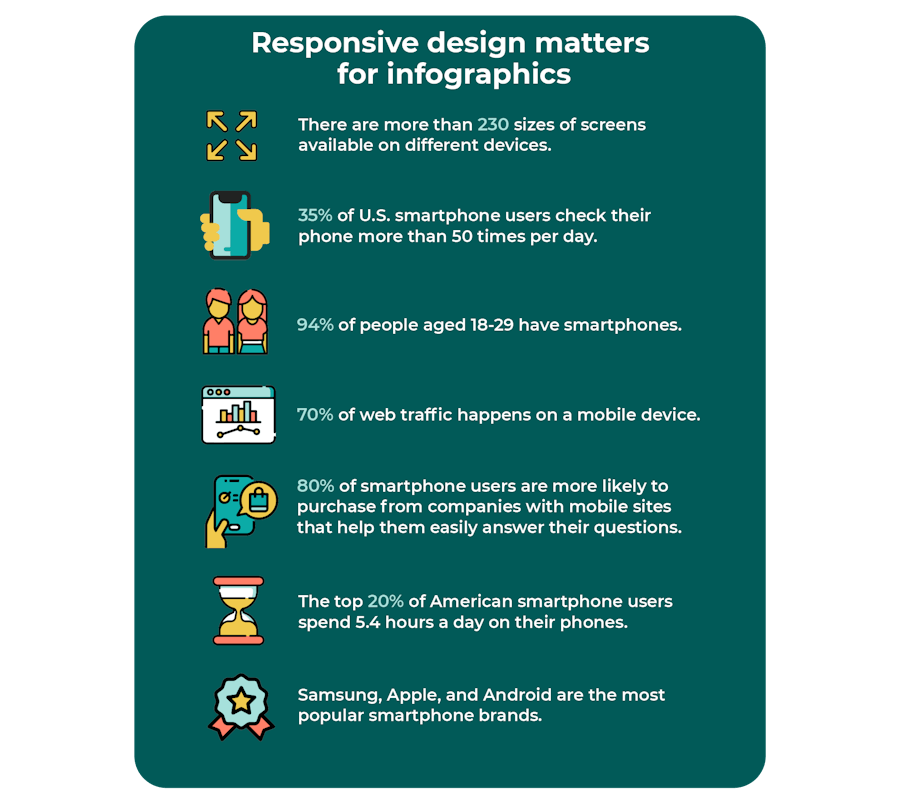
With more than 2.8 billion smartphone users worldwide, making your content responsive is critical if you want to keep your mobile audience engaged. There is no one-size-fits-all when it comes to smartphone users. Smartphone and tablet users can use Samsung, Apple, or Android brands. Each of these brands offer various-sized phones and other mobile devices so your content must be responsive for each item and each brand.
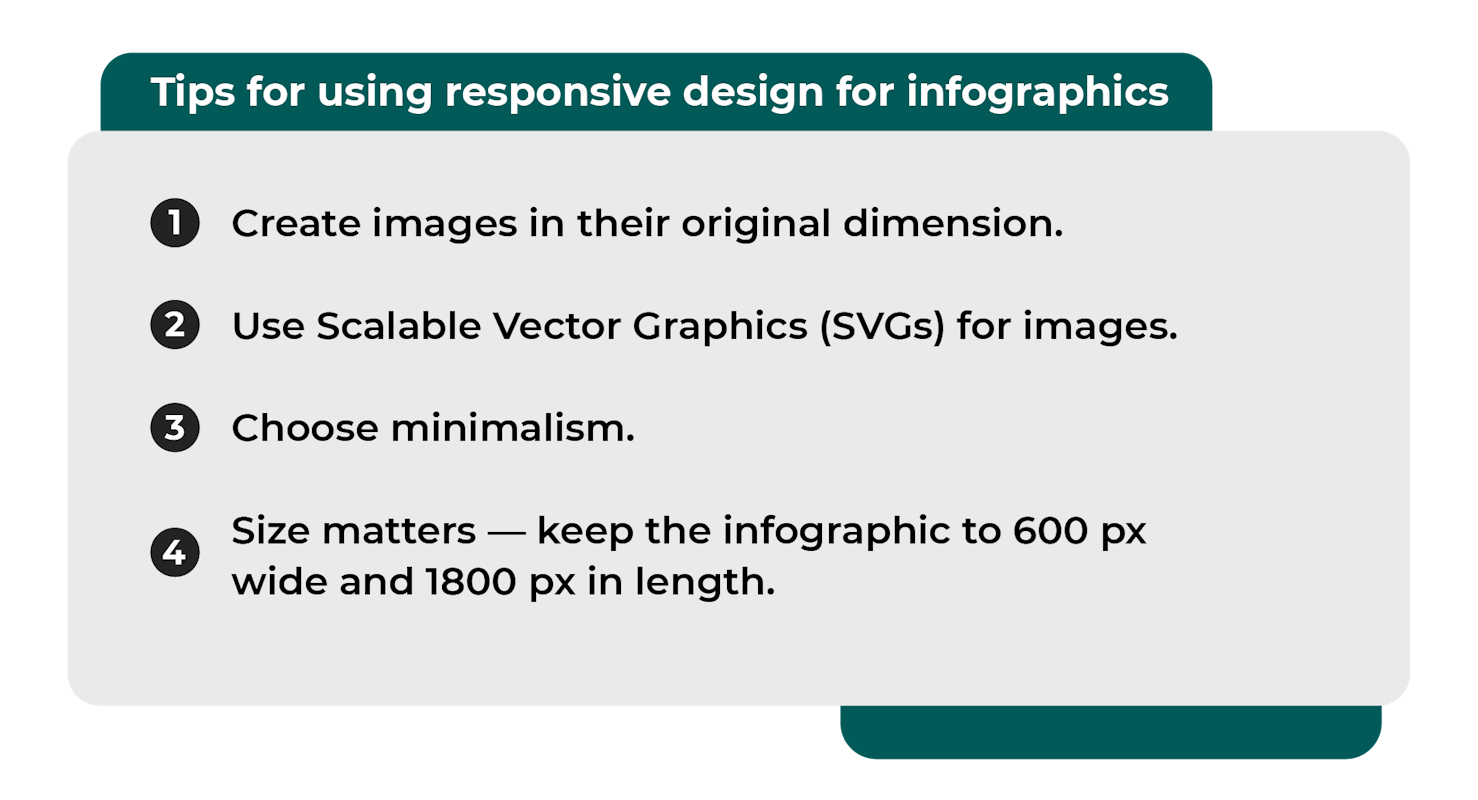
Instead of adaptive design — designing fixed dimensions for each piece of content — responsive design allows you to create one piece of content that can stretch or shrink and fit any screen.
7. Make It Shareable
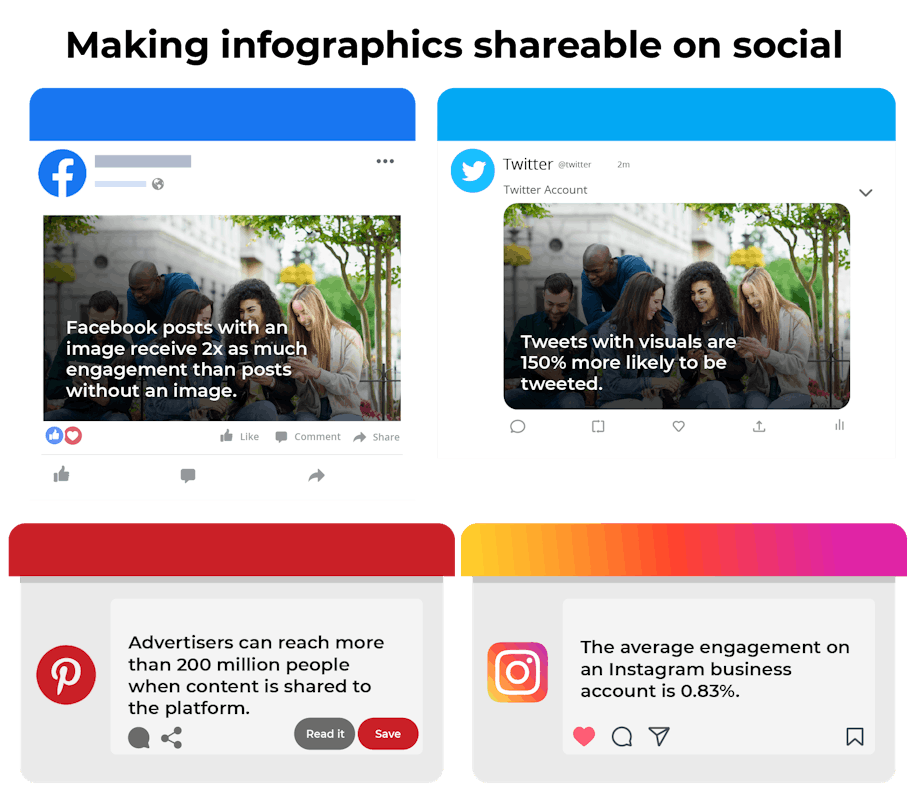
Infographics are liked and shared more than any other type of content. The key to getting your content shared by your readers is to make it shareable. The more snippets of content you have that can easily be shared by your brand and readers, the higher likelihood you will see the different snippets pop up on your news feed.
It also makes it easier for your brand to share multiple pieces of content across its social platforms rather than the infographic as a whole.
Mobile viewing of content is at an all-time high. When you adjust your branding content strategy to fit a mobile-first world, your brand is already ahead of the competition. Mobile-friendly infographics are your key to delivering clear and concise information.
If you have questions about how to optimize your marketing content and make sure it is responsive, First Page Strategy can help. Contact us here to connect and we’ll give you key insights to transform your content strategy.
Sources:
- https://blog.hubspot.com/marketing/visual-content-marketing-strategy
- https://review42.com/resources/smartphone-statistics/
- https://www.infographicdesignteam.com/blog/make-sure-infographic-mobile-friendly/
- https://www.socialmediatoday.com/technology-data/how-make-your-infographics-mobile-friendly
- https://rockcontent.com/blog/designing-infographics-mobile
- https://www.digitalinformationworld.com/2017/01/how-do-infographics-perform-in-mobile-first-strategy.html

